Hearing

Past work in the Cognitive NeuroSystems Lab includes studies of human spatial hearing using psychoacoustic methods. These studies include experiments performed by Tom Lappas as part of his doctoral dissertation work. One question studied is whether we are naturally sensitive to spatial edges in sound field intensity in the same way that we are visually sensitive to edges in light pattern intensity. The evidence for edge sensitivity in human vision is voluminous. One source of evidence concerning visual processing is perceived simultaneous contrast; a gray disk, when surrounded by a lighter area, appears darker than when surrounded by a darker area. The visual system evidently compares the light level received from the gray disk to light levels found in neighboring regions and enhances any difference found. Is there simultaneous contrast in spatial hearing?
 |
Simultaneous contrast in vision. The two gray disks at left are physically identical; the light intensities which reach the eyes are the same. Nevertheless, most people report the following illusion: the disk on the left, surrounded by black, appears lighter than the disk on the right. This simultaneous contrast is taken as evidence for the visual system's comparing light levels at nearby locations when judging lightness. Any difference found is enhanced perceptually. In this example, the gray disk at left is physically more intense than the black surround; this difference is enhanced to make the gray disk at left appear lighter. The gray disk at right is physically less intense than the white surround; this difference is enhanced to make it appear darker. This perceptual illusion is evidence for our visual systems' sensitivity to edges in light level, like those between the disks and their surrounds. |
A second source of evidence for visual sensitivity to spatial edges comes from experiments which measure spatial frequency contrast sensitivity. Sensitivity to bar patterns using shades of gray (no color) is highest at intermediate spatial frequencies (intermediate bar width); sensitivity is measurably smaller at lower frequencies (broader bars) or at higher frequencies (narrower bars). The spatial frequency contrast sensitivity function thus has a bandpass characteristic: peak sensitivity is found for a stimulus of intermediate frequency. This finding for vision dovetails nicely with the result for simultaneous contrast, because it can be shown that visual mechanisms which compare light intensities in neighboring regions will give rise to a spatial frequency contrast sensitivity with a bandpass characteristic. Does auditory spatial processing produce a spatial frequency contrast sensitivity with a bandpass characteristic?
We performed auditory experiments on simultaneous contrast and on spatial frequency contrast sensitivity to see if human hearing is sensitive to edges. The brief answer is no. Results suggest that spatially broad, non-opponent mechanisms mediate human sensitivity to spatially-patterned level modulations of incoherent noise fields: no edge sensitivity in human hearing.
Methods
We use a custom surround-sound system to produce our auditory stimuli.
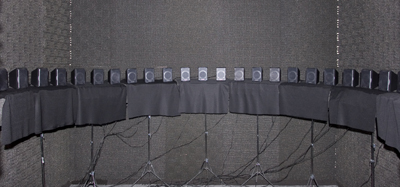 |
Speaker system. 23 speakers (Creative Labs Inspire P7800) are arrayed regularly about a semicircle of radius 122 cm (48 in) that is centered on the position of the listener's head and that spans the directions left, through front and center, to right, in the horizontal plane. The speakers are placed regularly at angular separations of 8.18 deg (180 deg / 22 inter-speaker intervals) in a room of dimensions 3.05m (10 ft) by 3.05m by 3.05m. Sonex acoustical foam panels on walls and ceiling reduce reverberation in the carpeted room. Speaker output is controlled by computer using C++/OpenAl software. In the work described here, each speaker puts out a distinct white noise waveform filtered to a passband (click here to hear a filtered white-noise waveform). The computer can modulate the amplitude of each speaker's waveform independently (click here to hear an amplitude-modulated waveform). The system can thus produce an incoherent noise field that is patterned both as a function of time and as a function of speaker spatial position: produce a spatio-temporal pattern. |
Simultaneous Contrast
We have a negative result for simultaneous contrast in hearing. We have formalized this result with a particular experiment in which we measured the nulling modulations required to cancel contrast induced in a central region caused by modulating surround intensity. This experiment is confirmed by a number of observations in which we varied center width, center position relative to listener, the temporal frequency of the surround modulation, and speaker noise waveform frequency characteristics.
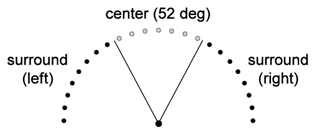 |
Surround speakers to left and right presented noise waveforms at a level modulated sinusoidally in time. We measured the effect of this surround modulation on the perceived sound level of the zone defined by the seven central speakers. |
The sound levels of the surround speakers at left and right were modulated in time about an intermediate sound level: loud - soft - loud - soft etc. The sound levels of the center speakers were kept constant: always producing the same, intermediate sound level. The idea is for the center speakers to constitute a zone like the gray disk in the vision example presented above, and for the surround speakers to range from loud (white surround) to soft (black surround). Does the listener perceive a change in the level of the central zone? Were there simultaneous contrast in hearing, one would expect that when the surround is loud, the center should be perceived as relatively soft, and when the surround is soft, the center should be perceived as relatively loud. Such a perceived effect would be induced by the surround modulation.
 |
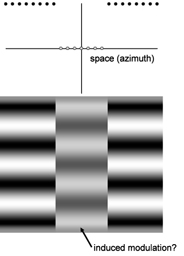 |
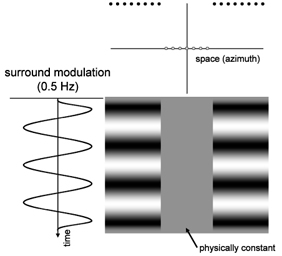
Physical stimulus (left) with steady center sound level and modulated surround. Hypothetical induced modulation (right) of the center caused by simultaneous contrast. Leftmost graph shows the temporal modulation of surround speaker sound level. Topmost graphs indicate that the surround speakers are modulated fully about their average values, indicated by the horizontal axis; center speakers are not modulated physically at all, and so remain constant at their average value. Space-time stimulus diagrams show the physically unchanging center (left) and how the center may be perceived to be modulated through induction (right). In these space-time diagrams, the shade of gray indicates sound level: lighter corresponds to higher sound levels, while darker corresponds to lower sound levels. Time varies in these diagrams from earlier (top) to later (bottom), while spatial position varies from left (at left of diagram), through front and center, to right (at right of diagram). |
To measure the strength of induced modulation in the center zone, one can physically modulate center speaker level in a way that is equal and opposite to the (hypothetical) induced modulation. The task of the listener is to select the amplitude and possibly the phase of such a nulling modulation so that the center zone is heard to have a steady sound level. Indeed, a nulling modulation applied to the center speakers could be of high amplitude and in phase with the surround modulation. By an in-phase nulling modulation is meant: when the surround is of higher-than-average sound level, so is the center; when the surround is of lower-than-average sound level, so is the center. In such cases, listeners can hear this nulling modulation and easily judge it to occur in phase with the surround modulation. One can also try a nulling modulation of low amplitude that is in phase with the surround modulation. Listeners have a harder time hearing such a nulling modulation, but when they do, more often than not judge it to be in phase with the surround. On the other hand, one can generate a nulling modulation of the center that is out of phase with the surround modulation. By an out-of-phase nulling modulation is meant: when the surround is of higher-than-average sound level, the center is lower; when the surround is of lower-than-average sound level, the center is higher. One can try a out-of-phase nulling modulation of high amplitude; in such cases, listeners hear the nulling modulation easily and judge it to occur out of phase. One can also try a nulling modulation of low amplitude which is out of phase with the surround modulation; in such cases, listeners have a harder time hearing such a nulling modulation but, when they do, more often than not judge it to be out of phase with the surround. The result is that listeners hear no modulation of the center when the amplitude of the nulling modulation is zero. This means that there is no induced modulation of the center caused by modulating the surround. In turn, this suggests that there is no simultaneous contrast in human hearing.
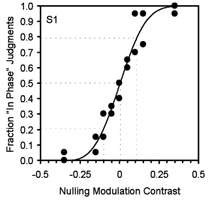 |
No simultaneous contrast measurable using the nulling technique; results shown for one of three listeners. The fraction of in-phase judgments is plotted as a function of nulling modulation contrast, which varies along the horizontal axis from physically out of phase (negative-valued) through physically in phase (positive-valued). Each data point represents the result of twenty trials for a particular nulling modulation contrast (40 total trials per nulling modulation contrast). A Weibull function is fit to the data (solid curve) and accounts for 0.9967 of the variance. The dotted line indicate the nulling modulation contrasts that correspond to 20.6%, 50% and 79.4% in phase judgments. |
Spatial frequency contrast sensitivity: the spatial MTF
The results of measurements of spatial frequency contrast sensitivity in human hearing agree with the result on simultaneous contrast. Spatial frequency contrast sensitivity has a lowpass characteristic, inconsistent with edge sensitivity, rather than a bandpass one. Contrast sensitivity functions of frequency are sometimes called modulation transfer functions (MTF), so the result says that the spatial MTF for human hearing is inconsistent with the sort of edge sensitivity found in vision.
We used Gabor function stimuli to measure contrast sensitivity. The Gabor functions are smooth, Gaussian functions of time that are ramped on and off smoothly. The spatial pattern that they present is the product of a Von Mises function window and a sinusoid of particular spatial frequency. The Von Mises window, like a Gaussian window but defined on the circle, causes the spatial patterning to ramp up smoothly as one moves from the left to the center direction and to ramp off smoothly towards the right.
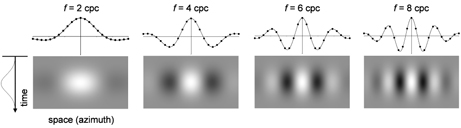 |
Space-time stimulus diagrams of Gabor function stimuli of spatial frequency 2 cycles per circle (cpc, leftmost), 4 cpc, 6 cpc and 8 cpc (rightmost). Graph at far left indicates the Gaussian time course of the stimulus time-domain window. The graphs at top show the spatial patterns provided by windowing sinusoids of indicated spatial frequency by a Von Mises function. One can vary the peak intensity with which such a stimulus is presented. At a low-enough peak intensity, such a stimulus cannot be discriminated from one for which all speaker intensities are kept constant at their average level. How much peak intensity is required for the pattern to be detected? |
Spatial MTFs for three listeners have a lowpass characteristic and a surprisingly low maximum resolvable spatial frequency. Rather than finding a peak sensitivity at an intermediate frequency, peak sensitivity is highest when the spatial sinusoidal carrier has a frequency of zero.
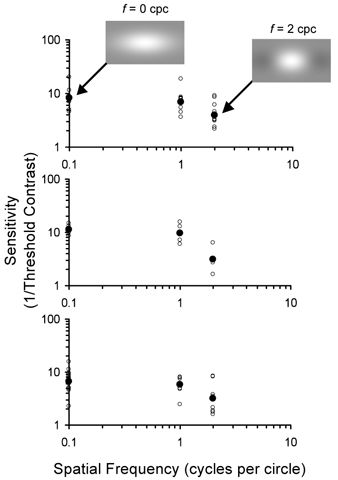 |
Sensitivity to isolevel spatial Gabor function patterns decreases monotonically as spatial frequency increases; shown are results for three listeners (top, middle, bottom). Sensitivity is defined to be the reciprocal of contrast at threshold: a higher sensitivity corresponds to a lower contrast at threshold. Sensitivity is plotted here on a logarithmic axis as a function of spatial frequency, also plotted logarithmically. Small, unfilled data points show results from single staircases, while filled data points show their geometric means. Sensitivity is greatest for each listener at a spatial frequency of zero cycles per circle and has a value close to ten (top, 8.18; middle, 11.3; bottom, 6.7). Threshold contrast is thus about 0.1. Sensitivity is slightly lower for all three listeners at spatial frequency one, lower still at spatial frequency two, and is zero at spatial frequency three and beyond. Spatial patterns at a spatial frequency of three cpc or higher are inaudible when presented at 100% contrast under the conditions studied here. The maximum resolvable spatial frequency in these experiments is two cpc, while the spatial MTF itself has a lowpass characteristic. |
The results of the simultaneous contrast and spatial frequency contrast sensitivity experiments, when taken together, suggest that human mechanisms of spatial hearing are not designed to detect or enhance spatial discontinuities in sound level: no edge processing in hearing. We are pursuing this result in a number of ways.
This work was supported by UCI CORCLR SIIG-2006-07-7 and by the UCI School of Social Sciences. We thank Mike Strauss and John Hagedorn for their help with early versions of this work. These studies were pursued by UCI Department of Cognitive Sciences graduate student Tom Lappas as part of his doctoral dissertation. A unpublished manuscript describing this work may be found here: Lappas, T.S. and D'Zmura, M. (2009) Human sensitivity to spatially-patterned amplitude modulation of incoherent noise fields in the horizontal plane.